Test Index
IBPS PO Prelims 23 Aug 2025 Shift 3 Solved Paper
Show Para
Question Numbers: 93-97The bar graph shows the number of girls in five different classes [A, B, C, D and E].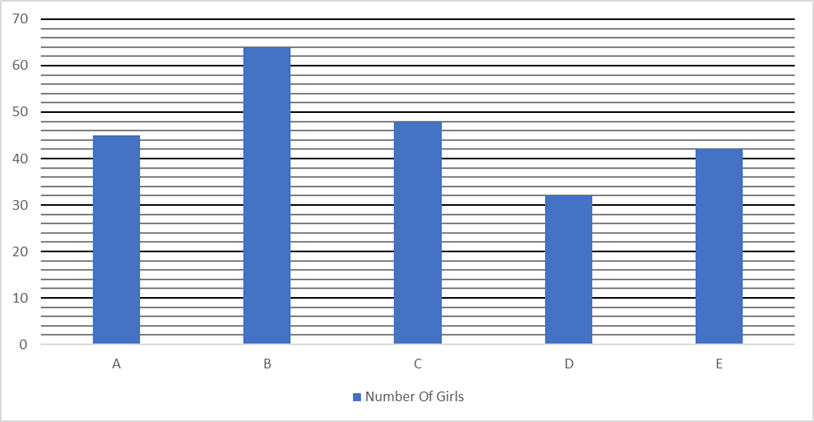 The table shows the ratio number of boys to girls of same five classes.
| Class | Ratio number of boys to girls |
| A | 6:5 |
| B | 3:4 |
| C | 5:6 |
| D | 7:4 |
| E | 9:7 |
© examsnet.com
Question : 93 of 100
Marks:
+1,
-0
Go to Question: