Test Index
IBPS PO Prelims 20 Oct 2024 Shift 1 Paper
Show Para
Question Numbers: 69-72 The pie chart shows the percentage distribution of number of students [ Boys + Girls] in five different classes [A, B, C, D and E]. Total number of students in all class together is 1200. Difference between boys and girls [Boys – Girls] in all class together is 200.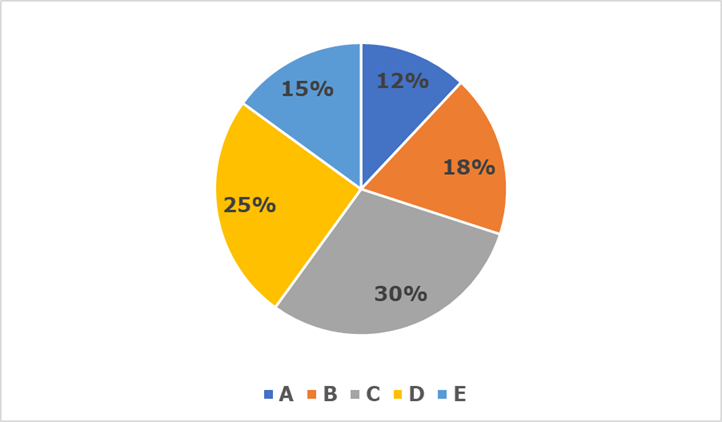 The pie chart shows the percentage distribution of number of boys in same five schools.
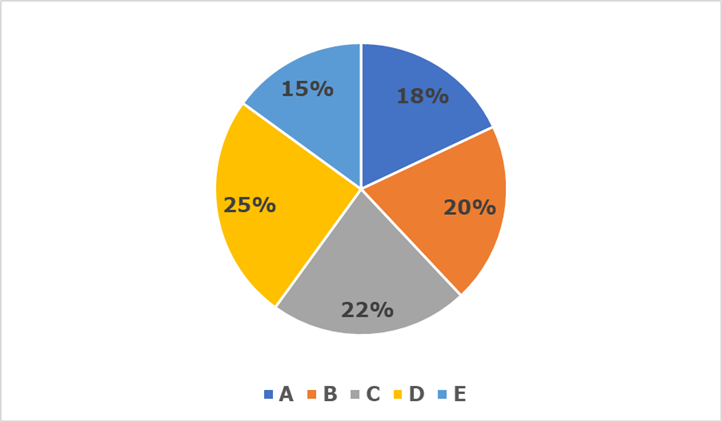
© examsnet.com
Question : 69 of 100
Marks:
+1,
-0
Go to Question: