Test Index
IBPS PO Mains 2019 Paper for online practice
Show Para
Directions (Qs. No. 16-20): The following Pie graph showsthe distribution of total population of 7 villages in year2019 and Line graph shows the percentage population which is below poverty line in respective villages in thesame year 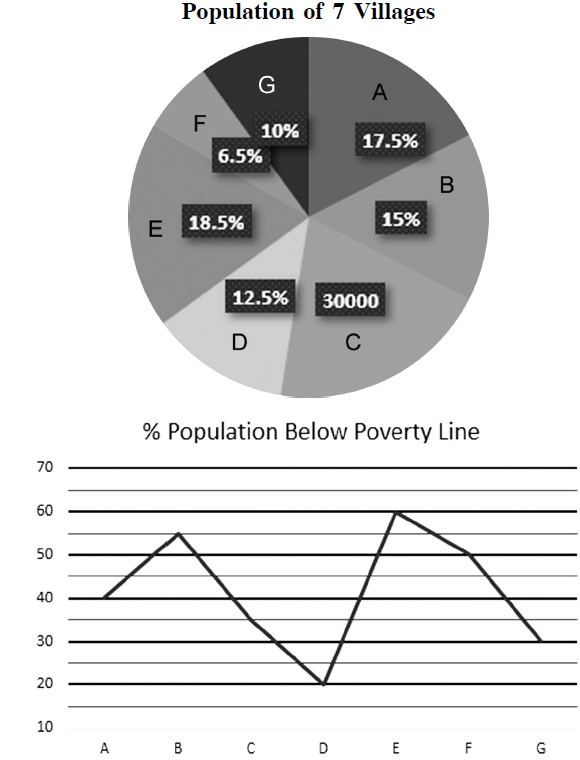
© examsnet.com
Question : 16 of 154
Marks:
+1,
-0
Go to Question: