Test Index
IBPS PO Mains 12 Oct 2025 Shift 1 Paper
Show Para
Question Numbers: 119-121Directions: Study the following pie chart carefully to answer the questions that follow.The bar chart represents the total number of people (male + female) who consumed alcoholic beverages in three cities, while the line graph shows the total number of people (male + female) who consumed non-alcoholic beverages in those cities.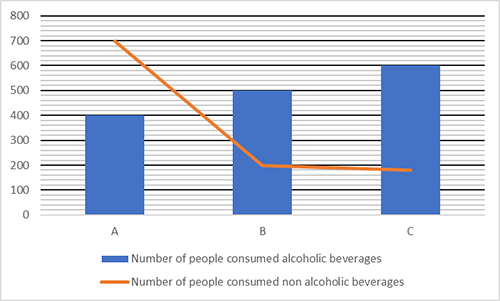 The table below provides further information:
| City | Alcoholic beverages | Non-alcoholic beverages |
|---|---|---|
| A | Number of males is 200 more than the number of females | Number of females is 40 more than the number of males |
| B | Number of males is 66.66% of the number of females | Number of females is 50% more than the number of males |
| C | Number of females is 28.57% less than the number of males | Number of males is 50% of the number of females |
© examsnet.com
Question : 120 of 145
Marks:
+1,
-0
Go to Question: