Test Index
AP ICET 2024 6th May 2024 Shift 1
Show Para
Questions from 61 to 65 Data Analysis using Pie ChartThe Directions: The following Pie chart shows Number or Percentage of women employees in a company from to . Study it carefully and answer the questions from 61 to 65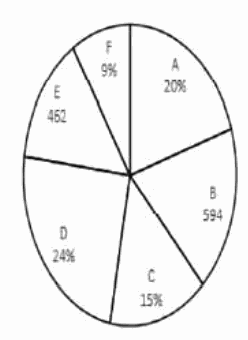
© examsnet.com
Question : 64 of 200
Marks:
+1,
-0
Go to Question: