
Test Index
AIPMT 2011 Biology Solved Paper
© examsnet.com
Question : 100 of 100
Marks:
+1,
-0
The curve given below shows enzymatic activity with relation to three conditions , temperature and substrate concentration. 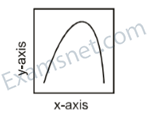 What do the two axis ( and ) represent ?
| x - axis | y - axis |
|---|---|
| (1) enzymatic activity | |
| (2) temperature | enzyme activity |
| (3) Substrate concentration, | enzymatic activity |
| (4) enzymatic activity | temperature |
Go to Question: