Test Index
IBPS Clerk Mains 2016 Paper
Show Para
DIRECTIONS (1-5):- Refer the graph and answer the given questions. The following line graph shows the number of products sold by company A and B during six years.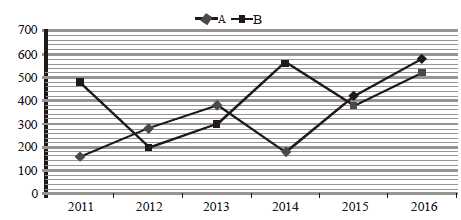
© examsnet.com
Question : 1 of 200
Marks:
+1,
-0
Go to Question: