Test Index
Kinetic Theory
© examsnet.com
Question : 3 of 14
Marks:
+1,
-0
Figure shows plot of PV/T versus P for kg of oxygen gas at two different temperatures. 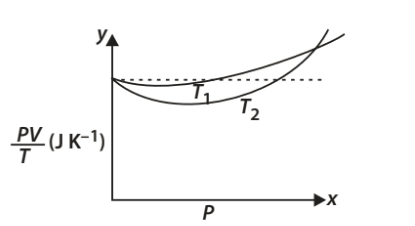 (a) What does the dotted plot signify?(b) Which is true: ?(c) What is the value of PV/T where the curves meet on the y-axis?(d) If we obtained similar plots for 1.00 × 10⁻³ kg of hydrogen, would we get the same value of PV/T at the point where the curves meet on the y-axis? If not, what mass of hydrogen yields the same value of PV/T (for low pressure hightemperature region of the plot)?(Molecular mass of
Solution:
(a) Since the dotted plot is parallel to P-axis, it tells that value of remains constant even when P is changed.(b) Curve at temperature is more close to the dotted plot than the curve at the temperature . Since the behaviour of a real gas approaches the perfect gas behaviour, as the temperature is increased therefore (c) If the amount of gas under consideration is 1 mole, then the value of PV/T, where the curves meet PV/T-axis will be For oxygen, molecular mass is 32.0 g i.e. . Since mass of oxygen gas under considerations is kg, the value of PV/T, where the curves meet the PV/T-axis is given by (d) If we obtained similar plots for kg of hydrogen, the value of PV/T, where the curves meet the y-axis will not be the same.Since molecular mass of hydrogen is kg, the mass of hydrogen that will yield same value of PV/T i.e., will be
© examsnet.com
Go to Question: