Test Index
ICSE Class X Math 2016 Paper
Show Para
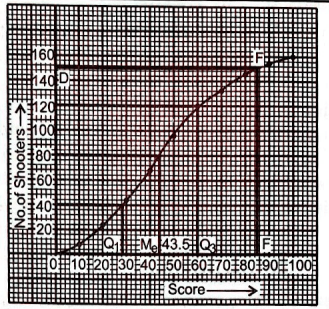
The table shows the distribution of the scores obtained by 160 shooters in a shooting competition. Use a graph sheet and draw an ogive for the distribution. (Take scores on the axis and 2 shooters on the -axis).
Use your graph to estimate the following :
| Scores | No. of shooters |
|---|---|
| 0-10 | 9 |
| 10-20 | 13 |
| 20-30 | 20 |
| 30-40 | 26 |
| 40-50 | 30 |
| 50-60 | 22 |
| 60-70 | 15 |
| 70-80 | 10 |
| 80-90 | 8 |
| 90-100 | 7 |
© examsnet.com
Question : 30 of 57
Marks:
+1,
-0
The median.
Solution:
| Scores | No. of shooters | c.f. |
|---|---|---|
| 0-10 | 9 | 9 |
| 10-20 | 13 | 22 |
| 20-30 | 20 | 42 |
| 30-40 | 26 | 68 |
| 40-50 | 30 | 98 |
| 50-60 | 22 | 120 |
| 60-70 | 15 | 135 |
| 70-80 | 10 | 145 |
| 80-90 | 8 | 153 |
| 90-100 | 7 | 160 |
© examsnet.com
Go to Question: