Test Index
ICSE Class X Math 2015 Paper
Show Para
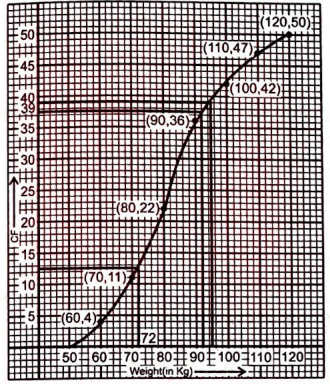
The weight of 50 workers is given below :
Draw an ogive of the given distribution using a graph sheet. Take on one axis and workers along the other axis. Use a graph to estimate the following :
| Weight in | No. Workers |
|---|---|
| 50-60 | 4 |
| 60-70 | 7 |
| 70-80 | 11 |
| 80-90 | 14 |
| 90-100 | 6 |
| 100-110 | 5 |
| 110-120 | 3 |
© examsnet.com
Question : 41 of 52
Marks:
+1,
-0
the upper and lower quartiles.
Solution:
| Weight in | f | cf |
|---|---|---|
| 50-60 | 4 | 4 |
| 60-70 | 7 | 11 |
| 70-80 | 11 | 22 |
| 80-90 | 14 | 36 |
| 90-100 | 6 | 42 |
| 100-110 | 5 | 47 |
| 110-120 | 3 | 50 |
| Σf=50 |
© examsnet.com
Go to Question: