Test Index
ICSE Class X Math 2013 Paper
Show Para
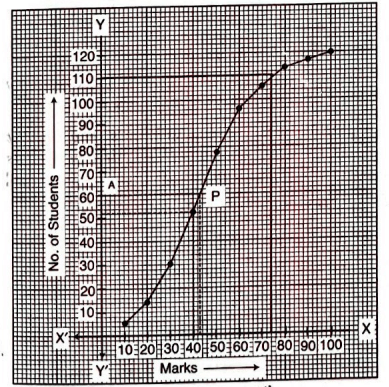
The mark obtained by 120 students in a test are given below :
Draw an ogive for the given distribution on a graph sheet. Using suitable scale for ogive to estimate the following :
| Marks | No. of Students |
|---|---|
| 0-10 | 5 |
| 10-20 | 9 |
| 20-30 | 16 |
| 30-40 | 22 |
| 40-50 | 26 |
| 50-60 | 18 |
| 60-70 | 11 |
| 70-80 | 6 |
| 80-90 | 4 |
| 90-100 | 3 |
© examsnet.com
Question : 41 of 46
Marks:
+1,
-0
The median.
Solution:
| Marks | No. of Students (f) | CumulativeFrequency |
|---|---|---|
| 0-10 | 5 | 5 |
| 10-20 | 9 | 14 |
| 20-30 | 16 | 30 |
| 30-40 | 22 | 52 |
| 40-50 | 26 | 78 |
| 50-60 | 18 | 96 |
| 60-70 | 11 | 107 |
| 70-80 | 6 | 113 |
| 80-90 | 4 | 117 |
| 90-100 | 3 | 120 |
| n=120 |
© examsnet.com
Go to Question: