Test Index
ICSE Class 10 Physics 2016 Paper
© examsnet.com
Question : 38 of 73
Marks:
+1,
-0
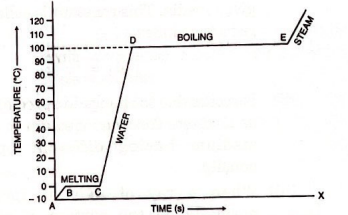
Some ice is heated at a constant rate, and its temperature is recorded after every few seconds, till steam is formed at . Draw a temperature time graph to represent the change. Label the two phase changes in your graph.
Solution:
© examsnet.com
Go to Question: