Test Index
CBSE Class 12 Physics 2020 Delhi Set 1 Paper
© examsnet.com
Question : 19 of 37
Marks:
+1,
-0
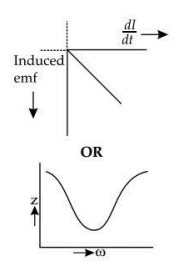
Plot a graph showing variation of induced e.m.f. with the rate of change of current flowing through a coil. OR A series combination of an inductor (L), capacitor (C) and a resistor (R) is connected across an a.c. source of emf of peak value and angular frequency . Plot a graph to show variation of impedance of the circuit with angular frequency .
Solution:
© examsnet.com
Go to Question: